Preference: LONG positions @ 99.95 with 100.45 & 100.85 as next targets.
Alternative scenario: The downside breakout of 99.8 will open the way to 99.55 & 99.1.
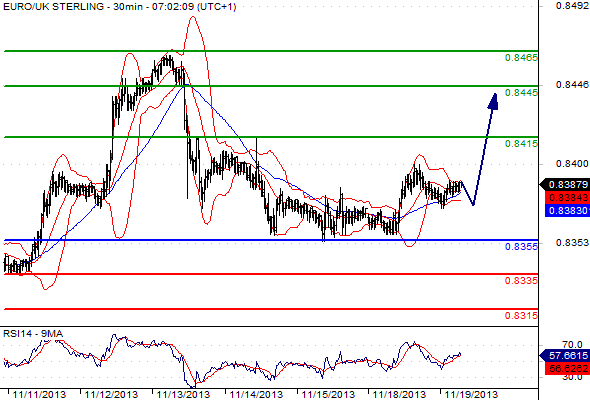
Comment: the pair is pulling back on its support ahead of further advance.

The red lines are the supports, the green lines are the resistances and the blue line is the pivot point (the key level where we would turn bullish from bearish, or bearish from bullish). There is no one-way for calculating our supports and resistances. We favour the use of Fibonacci levels (either via a retracement or a projection), along with classical technical levels (gaps, horizontal lines, etc.). The choice will depend on the current market configuration.